By Ruby Pap

Sea-level rise has already become very damaging in Hawai΄i. Observed SLR-related problems include coastal erosion, episodic flooding, and drainage problems at high tide in some urbanized areas. This photo was taken at Salt Pond Beach Park during the king tide June 23. Note the large waves and overwash threatening to flood the salt-harvesting area. Ocean flooding in recent years has greatly affected this important Hawaiian cultural practice. Photo by Ruby Pap/Hawai‘i and Pacific Islands King Tides Project
As a Hawai‘i Sea Grant Extension Agent, I’ve had the valuable opportunity to interact with all kinds of people on Kaua‘i about climate change and sea level rise. I am impressed to see the community conversation has increased just in the five years I’ve been here. While previously considered more of an esoteric issue, pretty much everyone I talk to now expresses knowledge of sea level rise and concern for Kaua‘i’s future.
At the same time, while I get the sense that folks are onboard, there is a hesitation to go deep in conversation (no pun intended) due to the complicated nature of the data. Sea level rise means there will be flooding. Yes. But exactly how much flooding, in what form, and when? The fact that there is not one answer to this, often leads to frustration when trying to make progress in planning for and managing our risks. This column is my attempt to at least get everyone on the same page in terms of the latest data.
First, understand the mechanics of sea level rise. Put simply, as heat-trapping greenhouse gases are released into the atmosphere, temperatures rise. This causes the mass of the ocean to increase through thermal expansion and melting of land ice — Antarctica, Greenland, glaciers and ice caps.
Looking back in time, it is easy to track the pace of sea level rise. According to the National Oceanic and Atmospheric Administration’s 2017 report, “Global and Regional Sea Level Rise Scenarios for the United States,” global sea levels have been rising about a foot per century. As measured by satellite altimetry since 1993, global mean sea level (GMSL) (3.4 mm/year) is more than double the rate estimated by a global network of tide gauges during the 20th century (~1.4 mm/year).
GMSL is expected to accelerate rapidly due to unabated global warming. Here is where the science must shift to predicting rather than simply quantifying the past.
In 2013, the Intergovernmental Panel on Climate Change released its Fifth Assessment Report [AR-5], which projected GMSL by the end of 21st century on the basis of modeled greenhouse gas emission scenarios. Their worst-case scenario projected approximately 3 feet of GMSL by the end of the 21st century. Some criticized IPCC for being too conservative by not including the impacts of melting of Greenland and Antarctica in its projections. Indeed, some studies had already pushed the upper bounds of the projections to 6-foot-plus GMSL by 2100.
It is important to understand, however, that the IPCC is a global consensus body charged with vetting and evaluating a voluminous body of research and coming to scientific consensus. Given the highly politicized climate change debate, IPCC is heavily scrutinized on all sides (especially climate change deniers) and it must be very careful to not be discredited. At the time of AR-5 (2013), the science for modeling the inputs from ice melt was simply not refined enough to make the cut in the projections, although the report did acknowledged this important research. The IPCC Sixth Assessment Report is expected to be released in 2022.

Six representative sea level scenarios from NOAA (colored solid lines) compared to ranges of global mean sea level projections by IPCC and greenhouse gas scenarios (representative concentration pathways). Dashed lines illustrate new projections of Antarctic melt. Black line shows historical global mean sea level reconstruction (1800-2015). NOAA Scenarios: Black, extension of recent trend; Blue, intermediate low; Aqua, intermediate; Green, intermediate high; Orange, high; Red, extreme. Image courtesy of Sweet et al (NOAA) 2017
Since 2013, the science has continued to evolve. I couldn’t possibly list all of the published studies here, but instead rely on 2017 NOAA projections, which are based on that body of work. The new NOAA projections take into account modeling of potential rapid ice melt in Greenland and Antarctic ice sheets, and under its extreme scenario, GMSL would rise by 2.5 meters (m) (or 8.2 feet) by 2100. This is the high end of a set of six different projections ranging from 0.3 m to 2.5 m by 2100. The low-end projection is simply based on the historical rate, while the extreme end is based on maximum ice loss. Notably, the IPCC AR-5 worst-case scenario is considered an intermediate scenario of future GMSL in the NOAA report.
The NOAA report also sets forth regional, or relative sea level (RSL) responses covering the coastlines of the U.S. mainland, Alaska, Hawai‘i, the Caribbean and Pacific Island Territories.
Sea levels across the world’s oceans are actually bumpy due to, (1) shifts in oceanographic factors such as circulation, (2) changes in the Earth’s gravitational field and rotation, and the flexure of the crust and upper mantle, due to melting of land based ice, and (3) vertical land movement (subsidence or uplift). These factors have resulted in different sea level rise rates around the world — and regional adjustments to the projections.
To get a handle on Hawai‘i more specifically, I spoke with University of Hawai‘i’s Dr. Charles “Chip” Fletcher, recognized as one of the region’s preeminent climate change science scholars. Chip explained Hawai‘i is expected to exceed the GMSL perhaps by 25 percent due to global gravitational effects from melting ice sheets.
Adding to this, the variability of the Pacific Ocean makes placing global sea level rise projections into local context very complex. Fundamental characteristics of the El Nino Southern Oscillation may be changing and potentially growing in frequency and magnitude as the world warms. Other model projections indicate changing future wave patterns. All of this uncertainty can frustrate community adaptation planning efforts, but there are techniques out there to help deal with the uncertainty.
Let’s say the community is faced with decisions about rebuilding a bridge, relocating a road, or assessing a community’s vulnerability and options for adaptation over time. According to Dr. Fletcher, “Knowing how fast SLR can develop given a scenario of future greenhouse gas emissions is crucial for both mitigation and adaptation choices. Unfortunately there remains considerable uncertainty regarding the magnitude and timing of future SLR and this hampers adequate planning. Consequently, it is appropriate to model the impacts of future SLR using scenarios that capture a range of probabilities. Planners can then choose a scenario scaled to the planned lifetime of a given project.”
So which future GMSL scenario should we pick to look at? In all abundance of caution, some argue for the extreme scenario (currently 8.2 feet by 2100, according to NOAA) given the fact that we’ve lost traction at the Federal level in curbing greenhouse gas emissions. But there are also good arguments for using intermediate and lower projections, due factors such as scientific uncertainty, the cost of adaptation measures, the lifespan of the facility being developed, and the nature of the development proposed. For example, if we are talking about constructing a relatively benign facility along the coast that can easily be moved when threatened (such as a path), one can perhaps afford to take more risks with its location. However, when planning to build a more permanent, expensive structure with a low tolerance for risk, such as a waste disposal facility it may be prudent to be cautious and plan for the worst.

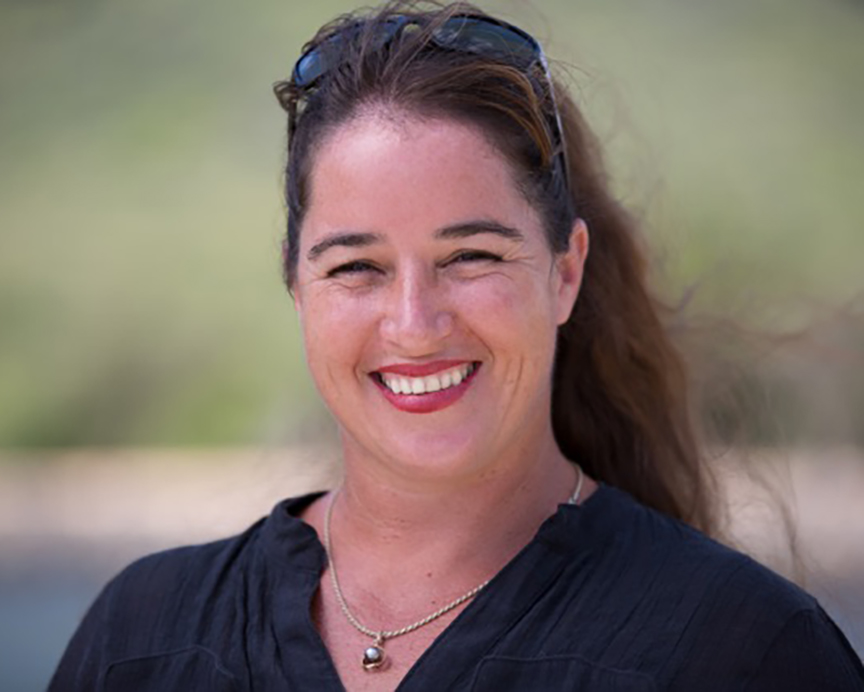
Ruby Pap
To be all inclusive and fully informed in our choices, it’s best to consider a range of scenarios and evaluate this risk tolerance when choosing what is best for our vulnerable communities. The most important part is that each and every one of us understands the scenarios being discussed and their underlying assumptions. I am hoping this article helps us all take one big step in that direction.
- Ruby Pap is a Coastal Land Use Extension Agent at University of Hawai‘i Sea Grant College Program. She can be reached at rpap@hawaii.edu.
Discover more from ForKauaiOnline
Subscribe to get the latest posts sent to your email.


Leave a Reply